
TRACKER™
Surface Tensiometer & Interfacial Rheometer

TRACKER™ Optical Surface Tensiometer
TRACKER™ provides automated characterization of surface and interfacial properties using controlled drop and bubble shape analysis.
It combines dynamic tension measurements, contact angle, adsorption kinetics and interfacial dilatational rheology in a single modular instrument.
What Does TRACKER™ Measure?
Surface & Interfacial Properties
-
Surface tension
-
Interfacial tension
-
Adsorption/desorption kinetics
Wettability
-
Contact angle
-
Dynamic contact angle
Interfacial Rheology
-
Dilatational viscoelastic modulus
-
Interfacial elasticity and viscosity
-
Dynamic response to controlled area/volume oscillations
Surfactant Characterization
-
Automatic Critical Micelle Concentration (CMC)
How Does It Work?
TRACKER™ captures the profile of a drop or bubble and analyzes its shape using Axisymmetric Drop Shape Analysis (ADSA). By fitting the experimental profile with the Young–Laplace equation, the TRACKER™ software determines surface tension, interfacial tension or contact angle.


Automated volume control also enables dynamic measurements, adsorption kinetics and controlled interfacial area oscillations for dilatational rheology.
TRACKER™ Key Features and Benefits
Automate dynamic interface measurements
Control drop or bubble volume and follow surface or interfacial properties over time.
Characterize interfacial rheology
Apply controlled area oscillations to quantify
the viscoelastic response of the interface.
Run complex experimental protocols
Automate phase exchange, CMC determination
and advanced measurement sequences.
Adapt the instrument to your application
Extend TRACKER™ with phase-exchange module, Piezoelectric Ceramic, Pressure Sensor and Pressure Cell.

Oil & Gas
Interfacial tension, wettability, surfactant adsorption and EOR studies.
Chemicals & Formulation
Surfactant characterization, CMC, emulsification and interfacial rheology.
Food & Beverage
Protein and surfactant adsorption, emulsions and interfacial stability.
Cosmetics & Personal Care
Formulation, wettability and emulsion/interface characterization.
Pharmaceuticals & Life Sciences
Encapsulation, interfacial films and adsorption kinetics.
TRACKER™ Configurations & Modules

TRACKER™ Dense Phase Exchange module
Study adsorption and desorption while changing the surrounding environment
The Dense Phase Exchange module enables the liquid surrounding a drop or bubble to be replaced during measurement while maintaining a controlled interface. It allows adsorption and desorption phenomena to be followed in real time, successive interfacial layers to be built, and interactions between surface-active molecules to be investigated under changing environmental conditions. Fully software-controlled, it can be integrated into automated measurement sequences.


TRACKER™ Drop Phase Exchange module
Change the composition inside a drop or bubble during measurement
The Drop Phase Exchange module enables the gas inside a bubble or the liquid inside a drop to be exchanged while keeping its volume controlled. This makes it possible to investigate how changes in the internal phase affect interfacial properties and to study sequential adsorption at the interface. It is particularly useful for gas exchange and for opaque oils that must be analyzed as a drop in a transparent surrounding phase.

TRACKER™ Piezoelectric Ceramic
Probe fast interfacial dynamics with high-frequency bubble oscillations
The TRACKER™ Piezoelectric Ceramic module generates controlled high-frequency oscillations of a gas bubble to probe interfacial viscoelasticity beyond the standard syringe-driven range. It is particularly useful for studying surfactants, proteins, polymers or particles whose interfacial response requires faster compression–dilatation cycles. Fully software-controlled, the module supports frequency sweeps and complex oscillation sequences for advanced interfacial rheology studies.

TRACKER™ Pressure Sensor
Detect and characterize the transition from a liquid interface to a structured interfacial membrane
The TRACKER™ Pressure Sensor measures the pressure inside a gas bubble in real time and uses it to calculate the apex tension. This extends interfacial characterization to situations where conventional drop-shape analysis is no longer sufficient, for example when a structured interfacial membrane forms and the bubble departs from a Laplacian shape. The module can be used alone or combined with the Piezoelectric Ceramic for advanced interfacial rheology studies.

TRACKER™ Pressure Cell
Characterize interfaces under controlled high-pressure and high-temperature conditions
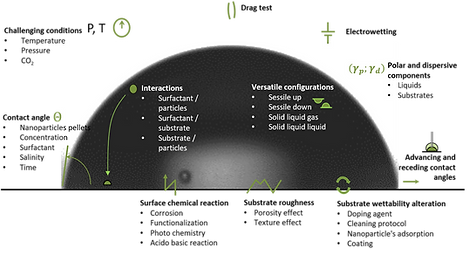
The TRACKER™ Pressure Cell extends surface and interfacial characterization to demanding operating conditions, with measurements up to 200 bar and 200°C. It enables surface and interfacial tension, contact angle and interfacial dilatational rheology to be investigated under pressure, making it particularly relevant for crude oils, CO₂ and supercritical CO₂ systems, as well as other high-pressure applications.

TRACKER™ Critical Micelle Concentration
Automatically determine the concentration at which micelles begin to form
The TRACKER™ Automatic CMC module automates the full determination of critical micelle concentration from surface tension measurements. Surfactant solutions are progressively dosed under software control, while TRACKER™ measures the equilibrium surface tension at each concentration and automatically calculates the CMC point. This helps optimize surfactant dosage, compare formulations and characterize concentration-dependent behavior.

TRACKER™ Application Notes & Use Cases

Standard error, five reasons you should check the drop profile
The TRACKER™ drop tensiometer relies on analyzing the shape of a Laplacian drop; any deviation introduces calculation errors. Therefore, the TRACKER™ evaluates the residuals between the theoretical Laplace profile and the actual drop contour to detect such deviations.
Five typical non-Laplacian cases are described: mechanical vibrations, profile interruptions by bubbles or dust, air bubbles trapped in drops, solid interfacial films, and moving profiles. Each case produces a characteristic residual pattern that helps diagnose the measurement problem.
Residual analysis is a quick, reliable quality control step for accurate interfacial measurements using the pendant or rising drop methods.

How to measure the interfacial properties of solid oils with TRACKER™
The solidifying properties of oils are harnessed in a wide range of industrial, food, cosmetic, and pharmaceutical applications. These properties stem from the ability of certain oils to crystallize, harden, or form solid structures under specific conditions, such as temperature changes or interactions with other substances.
However, measuring the surface tension of such oils can be challenging due to their solidifying nature, especially when their melting point is high. To address this, the TRACKER™ drop tensiometer is equipped with a specialized syringe holder that allows the sample to be heated both in the syringe and at the needle tip, ensuring accurate measurements.
To demonstrate the capabilities of the TRACKER™, the surface tension of three solid oils (coconut oil, butter, and paraffin wax) were measured at both the air-oil and water-oil interfaces...

Interfacial Rheology , A Tool to Probe Interfaces
While surface tension quantifies adsorption and interfacial activity, it cannot fully describe interfacial behavior. Two systems with the same surface tension can exhibit very different macroscopic properties.
By applying sinusoidal oscillations to the interfacial area, the interfacial viscoelastic modulus (E)* is determined, with its elastic (E′) and viscous (E″) components revealing molecular mobility and relaxation. For example, SDS and water/IPA mixtures have similar surface tensions but distinct interfacial responses: SDS shows strong viscoelastic behavior, while IPA does not.
This technique thus distinguishes between interfaces that are merely surface-active and those with significant elastic or viscous response, key for foam and emulsion stability. Interfacial rheology is therefore essential to link molecular-scale interactions to macroscopic properties like stability and texture in foams, emulsions, and dispersions...

Impact of frequency, amplitude and concentration on interfacial viscoelastic modulus
The interfacial viscoelastic modulus depends on three key experimental parameters: oscillation frequency, amplitude, and solution concentration. Using the TRACKER™, measurements were performed on interfaces stabilized by proteins, polysaccharides, and bitumen emulsions.
At low amplitude or frequency, molecules have time to diffuse and reorganize; at higher frequencies, interfaces behave more elastically. Increasing frequency raises the elastic modulus (E′) but decreases the viscous modulus (E″), consistent with diffusion-limited adsorption models. The amplitude effect shows that large deformations can weaken the interfacial network, particularly in plant–dairy protein blends. The concentration effect often follows a bell-shaped curve, with maximum elasticity at intermediate surface coverage.
The study concludes that E* is not an intrinsic material constant but depends on the mechanical deformation regime, emphasizing the need for well-defined measurement protocols.

Interfacial rheology: micro and macro illustrations
This note links molecular-scale interfacial properties to macroscopic foam and emulsion stability.
Surface-active molecules impart elastic and viscous behavior to interfaces, quantified by the interfacial viscoelastic modulus.
At the microscopic level, measuring E′ and E″ helps monitor molecular adsorption, reaction dynamics, or particle desorption (e.g., CO₂-induced chitosan destabilization). At the macroscopic scale, systems with higher surface elasticity show greater stability against coalescence, drainage, and Ostwald ripening. In emulsions, rigid interfacial films correlate with enhanced long-term stability (≥30 days).
Overall, interfacial rheology bridges molecular interactions and bulk material properties, providing a a powerful parameter for the characterization of fluid/fluid interfaces.

The deposition of a monolayer of phospholipids at the oilwater interface
Monolayers play a key role at interfaces between immiscible phases and can be formed by lipids, polymers, proteins, asphaltenes or particles. This application illustrates the formation of a phospholipid monolayer at an oil–water interface and shows how TRACKER™ can monitor its adsorption and interfacial properties. Such model interfaces are particularly relevant for studying emulsions, lipid droplets and biological membranes....

How to control the surface pressure of an interface
Using the TRACKER™ drop tensiometer, phospholipids were adsorbed at an oil/water interface, and surface pressure was adjusted by compressing or expanding the drop area. Increasing the surface area dilutes the monolayer, raising surface tension, while compression increases phospholipid packing and lowers it.
After adsorption equilibrium, sequential expansions and compressions allowed the creation of interfaces with different controlled pressures ranging from 5 to 28 mN/m.
This method enables the study of adsorption, desorption, and rheological properties of interfacial films under variable pressures. The approach is particularly relevant for modeling biological membranes and lipid droplets, where phospholipids govern interfacial stability.

How to determine the maximum surface pressure of a molecule
The maximum surface pressure (ΠMAX) defines the limit beyond which an adsorbed molecule is ejected from an interface.
Using the TRACKER™ drop tensiometer, proteins were adsorbed at an oil/water interface and subjected to successive compression and expansion cycles. Changes in surface tension (Δγ) were recorded to assess whether molecules remained adsorbed or desorbed.
For protein A, ΠMAX = 14.6 mN/m, indicating desorption at moderate pressure, while protein B remained strongly bound. This parameter ranks molecules by interfacial affinity and mechanical stability.
The method enables detailed analysis of molecular adsorption–desorption dynamics, crucial in biology, cosmetics, and emulsified systems...

How to determine the surface exclusion pressure of a molecule
The surface exclusion pressure (Πₑ) represents the maximum pressure above which a molecule can no longer insert into a lipid monolayer.
Using the TRACKER™ tensiometer, an oil/water interface was coated with phospholipids, and proteins were injected at different surface pressures. The additional pressure caused by protein adsorption (ΔΠ) was measured; when ΔΠ = 0, adsorption ceased, identifying Πₑ.
This parameter quantifies the affinity of biomolecules for lipid interfaces, influenced by lipid charge, phase state, and subphase conditions.
The method provides insight into molecular insertion mechanisms and protein–lipid interactions.